Have you ever wondered how the electric grid functions…or, for that matter, what it is? Providing some answers to those questions is the focus of this month’s Powerlines article. It is a continuation of a series of articles aimed at helping our members understand our industry and KEC’s place within it.
The electric grid is said to be the largest and most complex machine ever built by humans. It is comprised of over 200,000 miles of high voltage lines, thousands of switchyards and substations, and countless electric generation stations spread across the United States, Canada and Mexico. Other countries have their own electric grids.
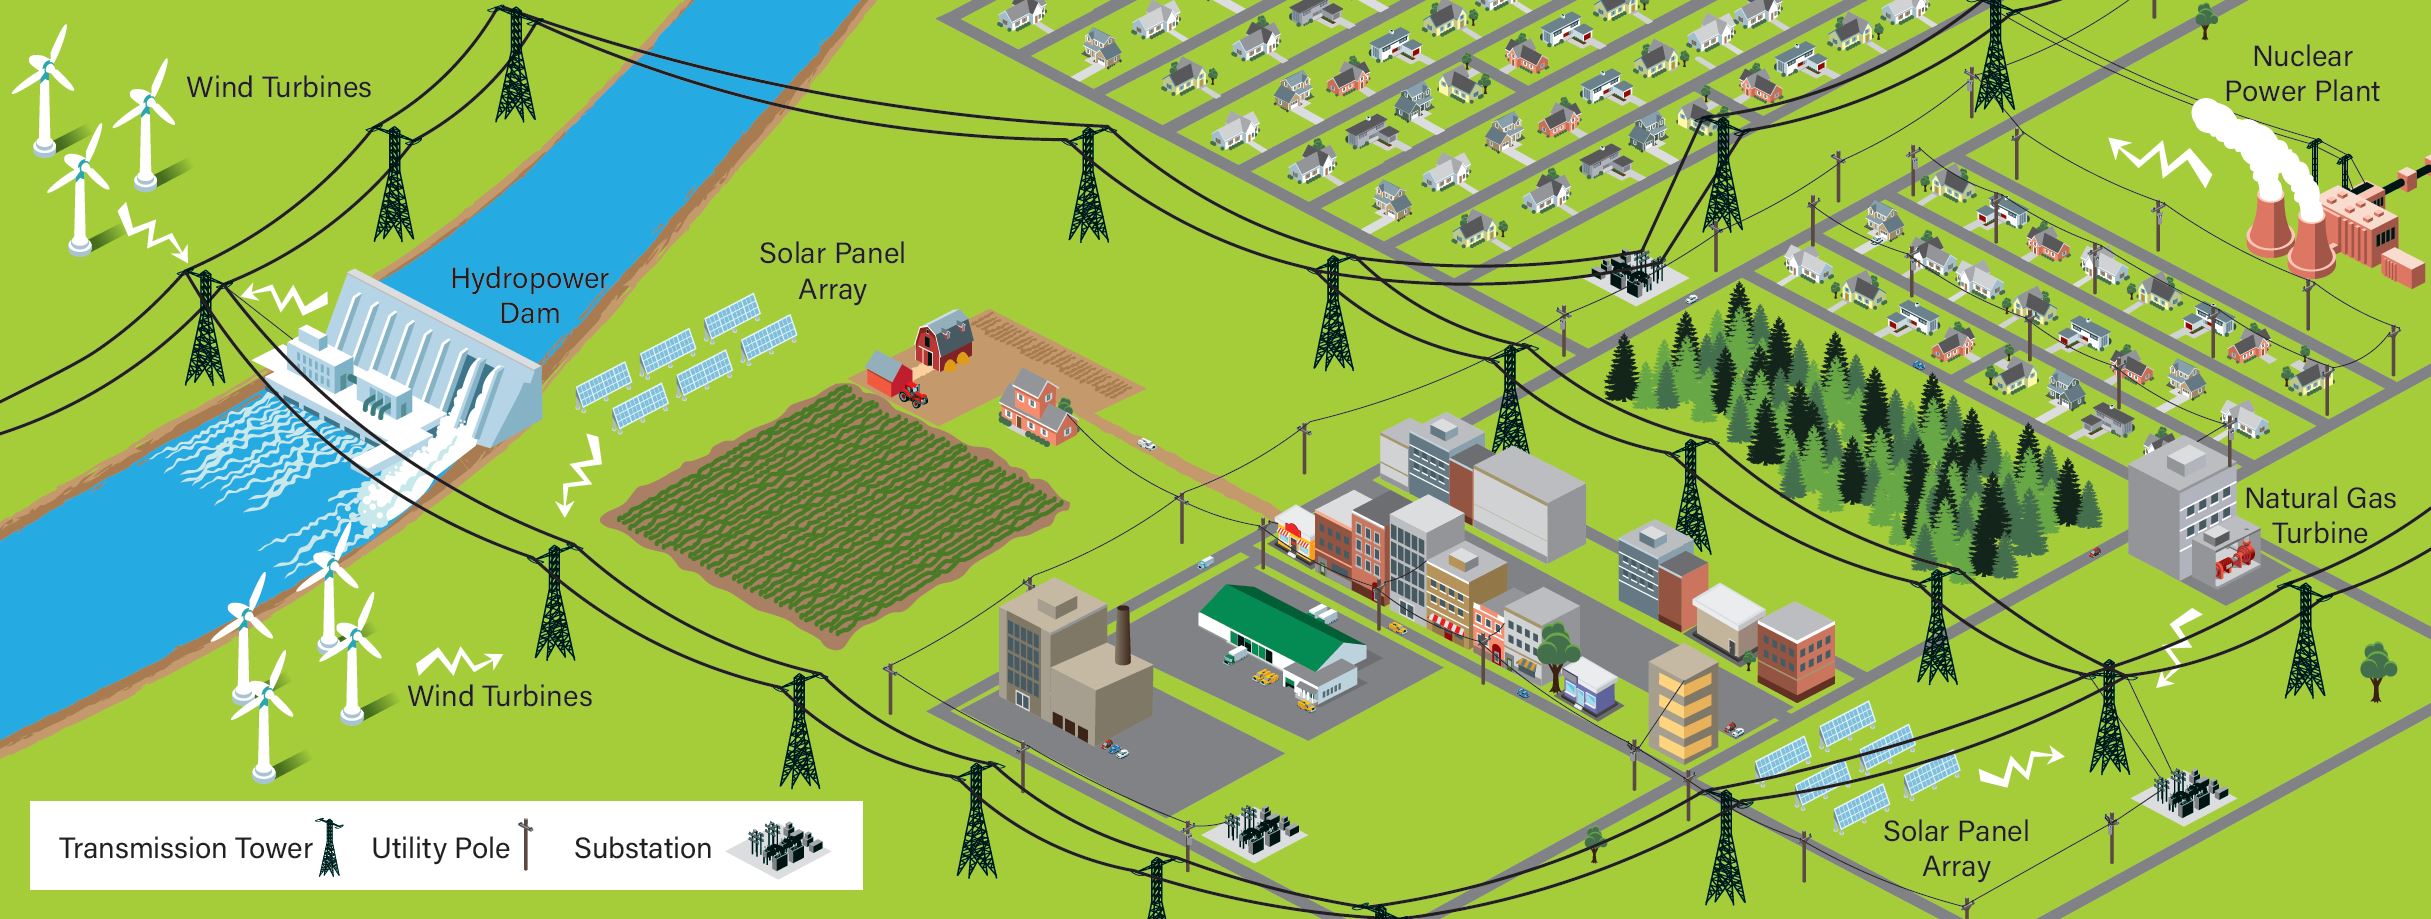
The best way to visualize the electric grid is as a huge spider web of interconnected high-voltage power lines that enable power to flow in any direction. Power generation stations are generally connected directly to these lines, with the power they produce being injected into them. The direction power flows on the transmission grid depends on where the demand for power is the highest in relationship to the amount of power being produced at any given time. Physics complicates this somewhat. Power flows are also dictated by the “distance” (technically “line resistance”) between where the power is produced and where it is being used. You can refer to the diagram below to help better visualize all this.
One important thing to understand about electric power is that it cannot be efficiently stored or inventoried for later use, at least in the quantities that flow through the electric grid. With a few niche and costly exceptions, humans have not yet solved that problem on an industrial scale. For this reason, the electrical power produced by the generation stations connected to the electric grid must be increased and decreased continuously throughout the day and night to match the amount of power being used by the homes, farms, businesses and industries that depend on it. So, who controls this?
The electric grid is split up into several somewhat arbitrary sections called balancing authorities, each with their own dispatching and control center. These centers function similarly to the air traffic control tower of an airport. The role of the dispatcher is to instruct the generation stations within its balancing authority how much power they should produce at any given time to continuously match the power being used within that same area. As you and I begin our workday and as businesses open the doors to their customers, the demand for electricity increases. To help visualize this, the chart below reflects the typical power consumption profiles for several types of load throughout a normal day. Somewhere connected to the grid is a generation station responding to a dispatcher’s directions to increase power production to match the sum of all those loads. Now consider this...not all power generation stations are capable of producing power when needed.
For example, solar can only produce power when the sun shines. On sunny days, solar farms produce a lot of power. On overcast days, they produce much less, and, at night, none at all. Wind farms produce power only when the wind is blowing. The stronger the wind, the more power is produced, but the force of the wind can change rapidly, affecting the amount of power produced. Nuclear power plants continuously produce large volumes of power. However, ramping their power up or down requires considerable time. For this reason, most nuclear plants are brought up to full production and left there for months at a time. Natural gas turbines and hydroelectric dams can be ramped up or down to match load much more easily than other power plants. All they need is more gas or water flowing through them. For this reason, they are the gems of the fleet. In many cases, they are also among the least costly resources to operate. 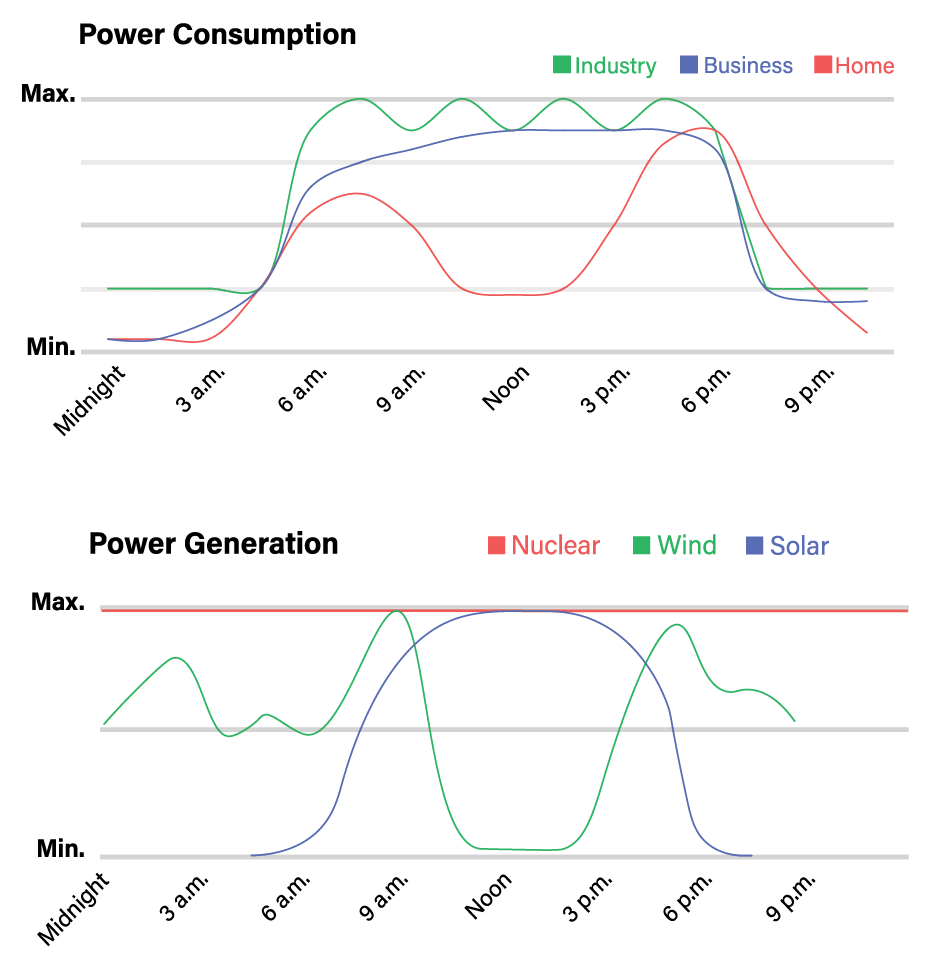
Interesting fact: During the extremely cold weather the region experienced in January of this year, the Pacific Northwest was deficit 5,000 megawatts (MW)* of power. To keep the grid stable, dispatchers had to import this power over high-voltage transmission lines from the desert Southwest. To put that into perspective, the amount of power being imported was equivalent to the output of five nuclear generation stations. The Pacific Northwest has only one—the Columbia Generating Station. The transmission paths connecting the Pacific Northwest to other areas were at capacity and incapable of importing more power. During this time, the vast number of wind farms installed throughout the Pacific Northwest produced a paltry 200 MW. The reason for this…the wind was not blowing. The power generation resource that enabled the grid to operate without disruption or curtailments was the federal dams that operate on the Columbia and Snake Rivers. Absent their ability to ramp up production, the region would likely have faced blackouts.
Finally, a note about KEC and our place within the grid. Our total electric load during that cold snap was 159 MW. Like most electric cooperatives, our total power requirements are insufficient to build our own fleet of generation facilities. In turn, we depend on others. Most of our power, about 70 percent of it, comes from our allocation of the output of the federal dams overseen by the Bonneville Power Administration. The rest of it, including all future load growth, must come from other resources. Just as you are a member of KEC, we are a member of a generation cooperative comprised of other distribution cooperatives like us. Collectively, we seek to acquire generation on a scale that achieves the economies necessary to make this viable for our members.
I’ll close with these thoughts. The grid is an amazing invention. It is also one on which we rely heavily. As you use power throughout your life, consider the electron (actually electricity) that begins its journey to your home or business from, in most cases, hundreds of miles away. That journey begins with the flip of a light switch in your home and a dispatcher’s order to a power plant to increase production to suit. At the speed of light, that power is delivered to where it’s needed. If a transmission line is down somewhere on the grid, that electricity simply uses a different path along the web of transmission lines to find its way to you.
*One MW of power equals 1,000,000 watts of power. It is the amount of power needed to power 10,000 100-watt light bulbs.